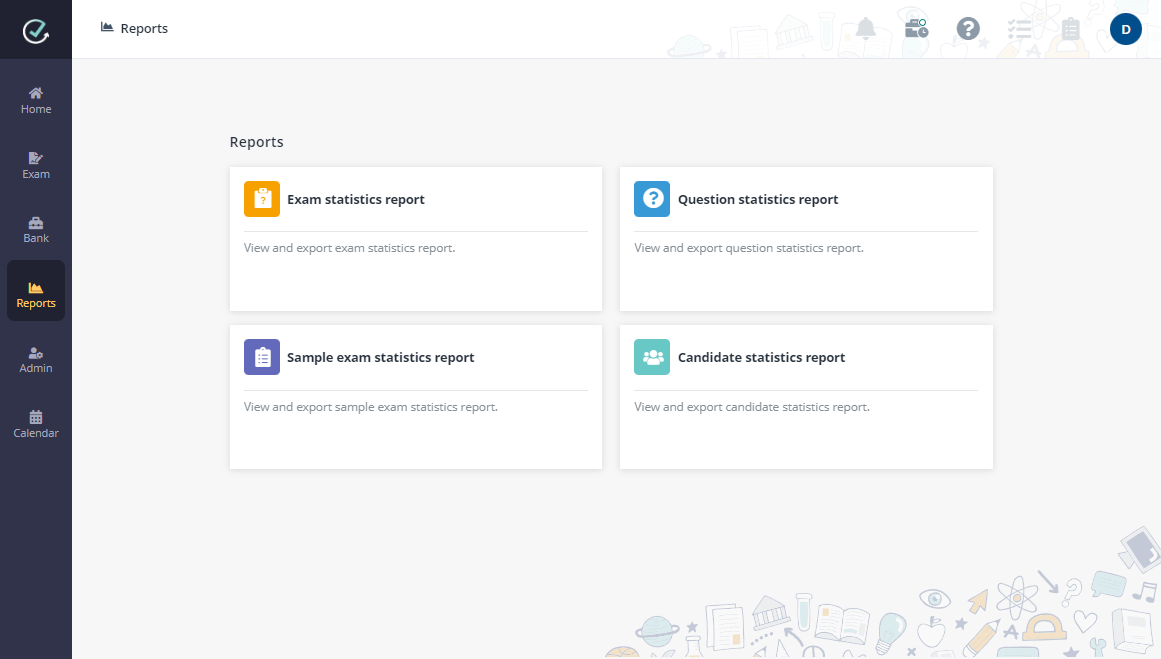
Through Examena > Reports, Exam admins can view multiple types of reports. Select a report type to view the corresponding report.

Derek wants to get an overview of all exams for the mid-term Spring semester and export a report. He can follow the steps below:
1. On the Exam statistics report page, use the filters to show the exams that match your filter conditions.
Alternatively, you can use the Search box in the upper-right corner to search for the exams by the keyword in their Exam name. The exams matching your search will be displayed in the table.
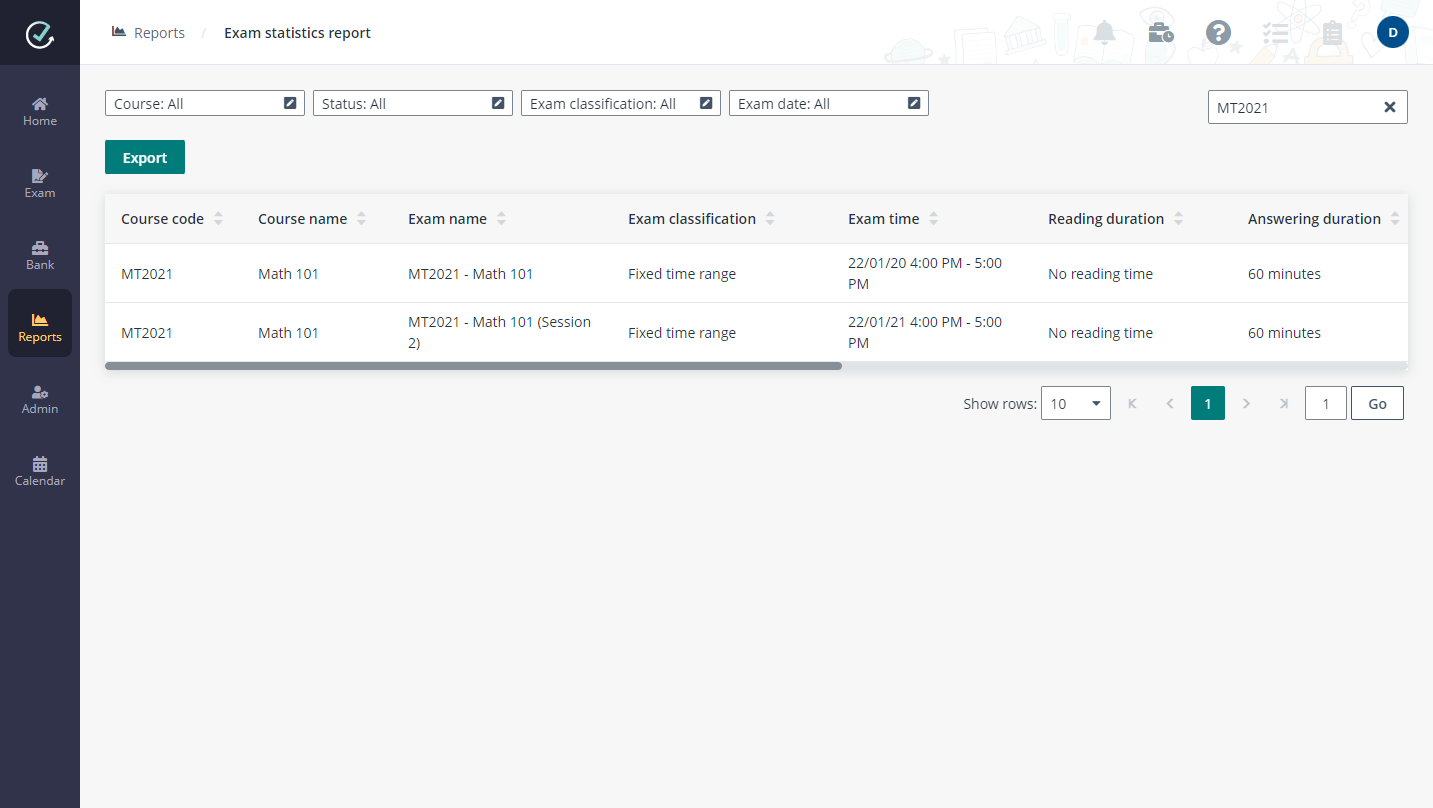
2. For a specific exam in the search result, you can click the number link in the Enrolled candidates column to check the exam attendance, click the number link in the Total marks column to check the exam marking progress, and click the number link in the No. of questions column to access the question statistics report directly.
3. You can also click Export to export the currently displayed exam statistics report.
Derek, as a member of exam administrators, wants to get an overview of all sample exams. He can follow the steps below:
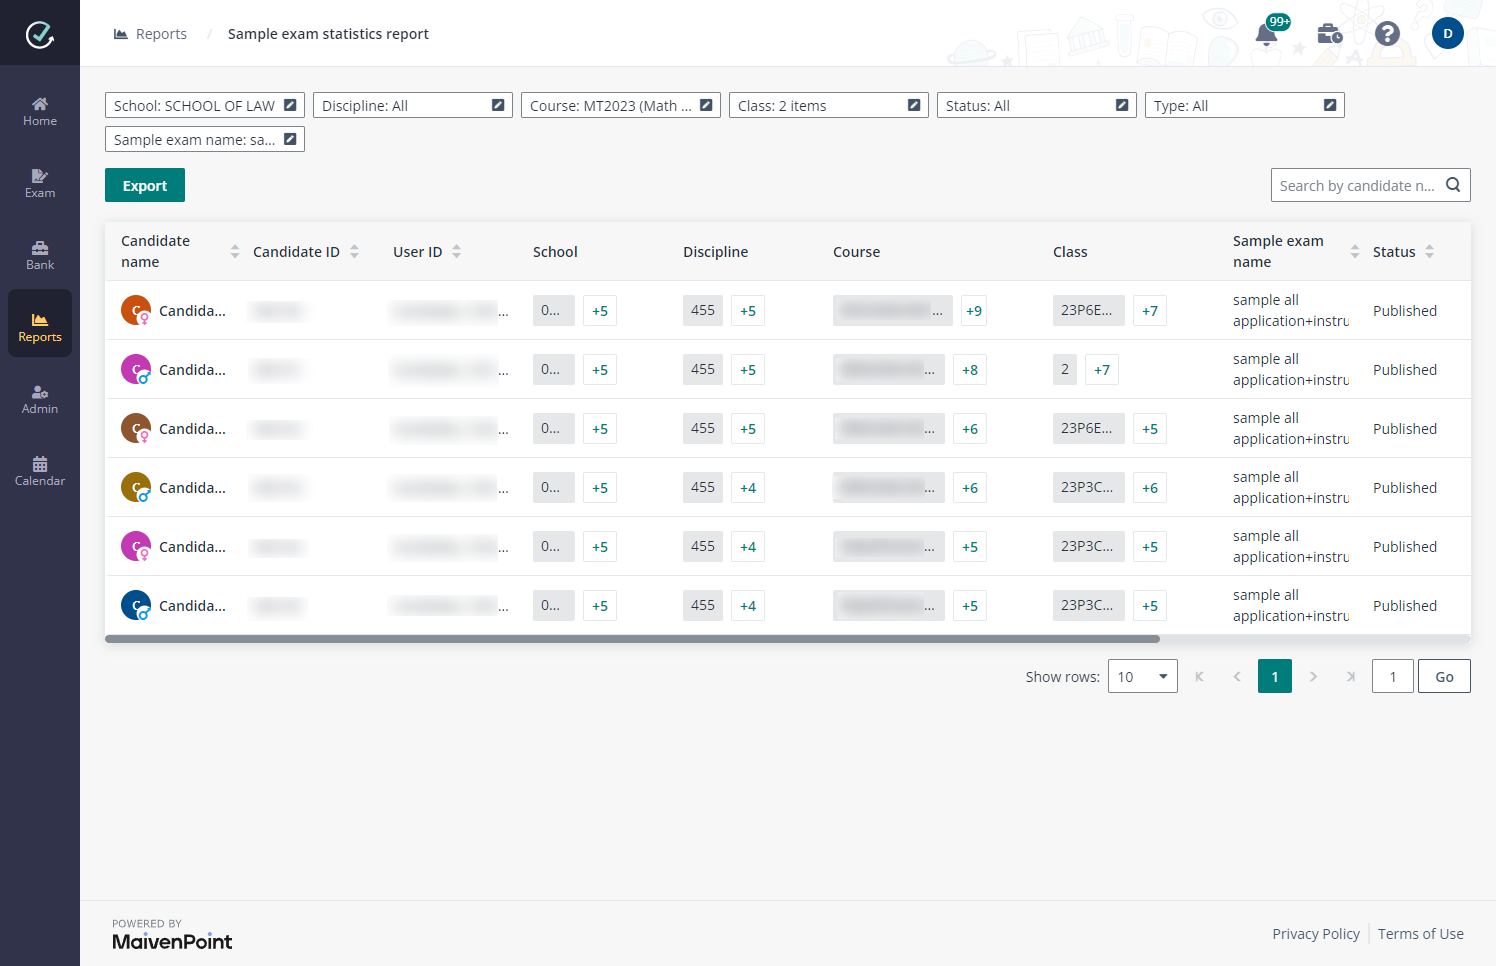
1. On the Sample exam statistics report page, use the Course, Class, Status, Type, or Sample exam name filter to show the sample exams that match your filter conditions. You can also use the Search box in the upper-right corner to search for candidates by the keyword in their Candidate name. The sample exams matching your search will be displayed in the table.
2. For a specific candidate in the search result, you can view the number of attempts of the sample exam and the last attempted time.
Derek wants to get an overview of all questions for the Math 101 course and export a report. He can follow the steps below:
1. On the Question statistics report page, use the filters to show the questions that match your filter conditions.
Alternatively, you can use the Search box in the upper-right corner to search for the questions by the keyword in their Question content. The questions matching your search will be displayed in the table.
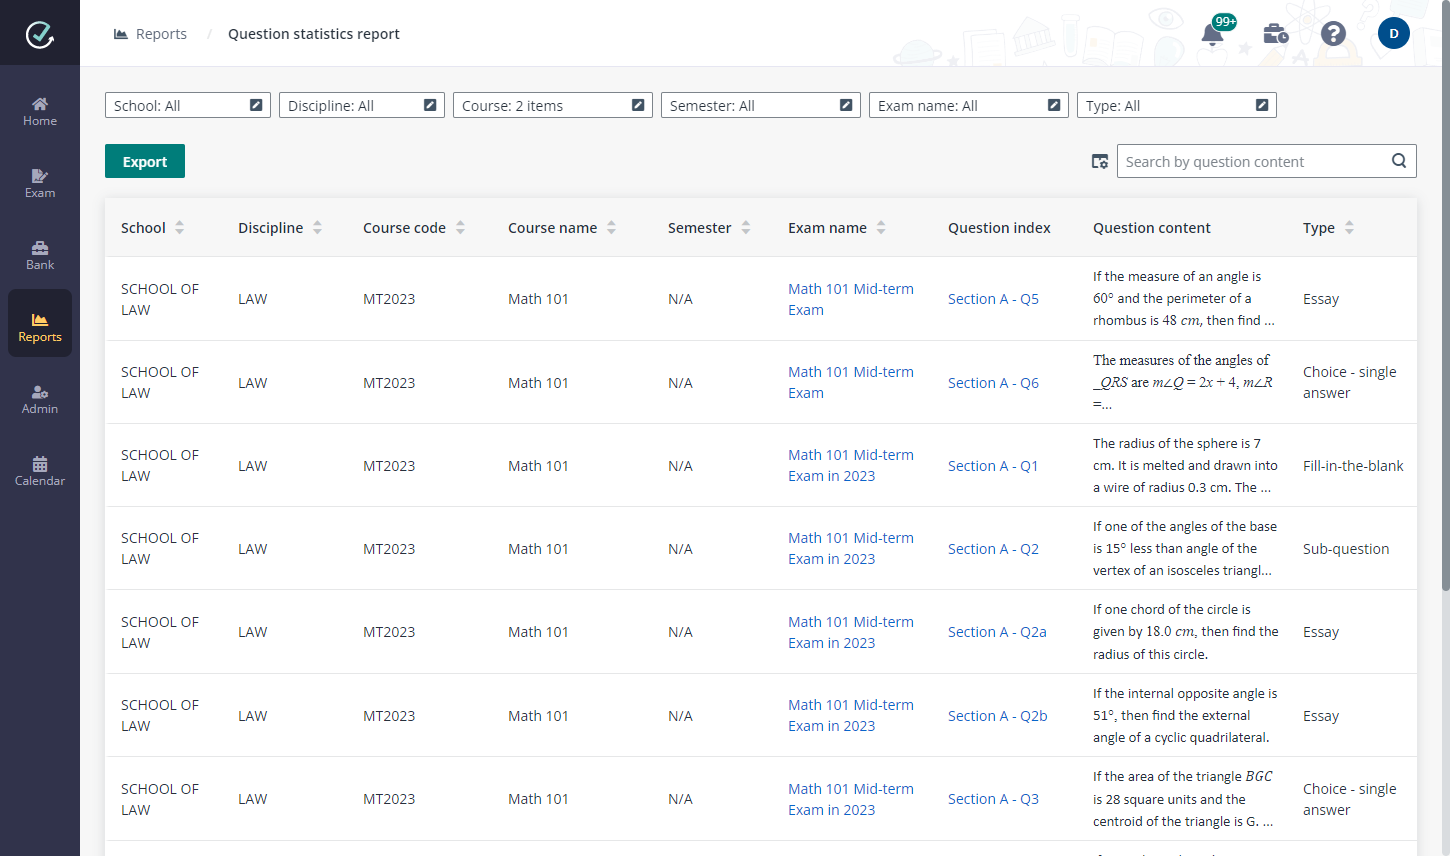
2. For the exams of which the enrolled candidates are classified by class and/or team, you can click the exam name link to only view the question statistics of the exam. The question statistics are displayed under the Class and/or Team tab.
3. For Choice questions, you can click the links in the Question index column to check the selectance of each option in the Options tab.
The Distractor analysis statistic is also displayed in the table to provide a measure of how well each of the incorrect options contribute to the quality of a choice question. The distractor point biserial correlation ranges from a low of -1.0 to a high of +1.0. The closer an incorrect option’s distractor point biserial correlation is to -1.0 the more reliable the option is considered because it discriminates well among candidates who did not score well on the exam and those who did. An effective distractor is one that is chosen by candidates who score low on the exam overall.
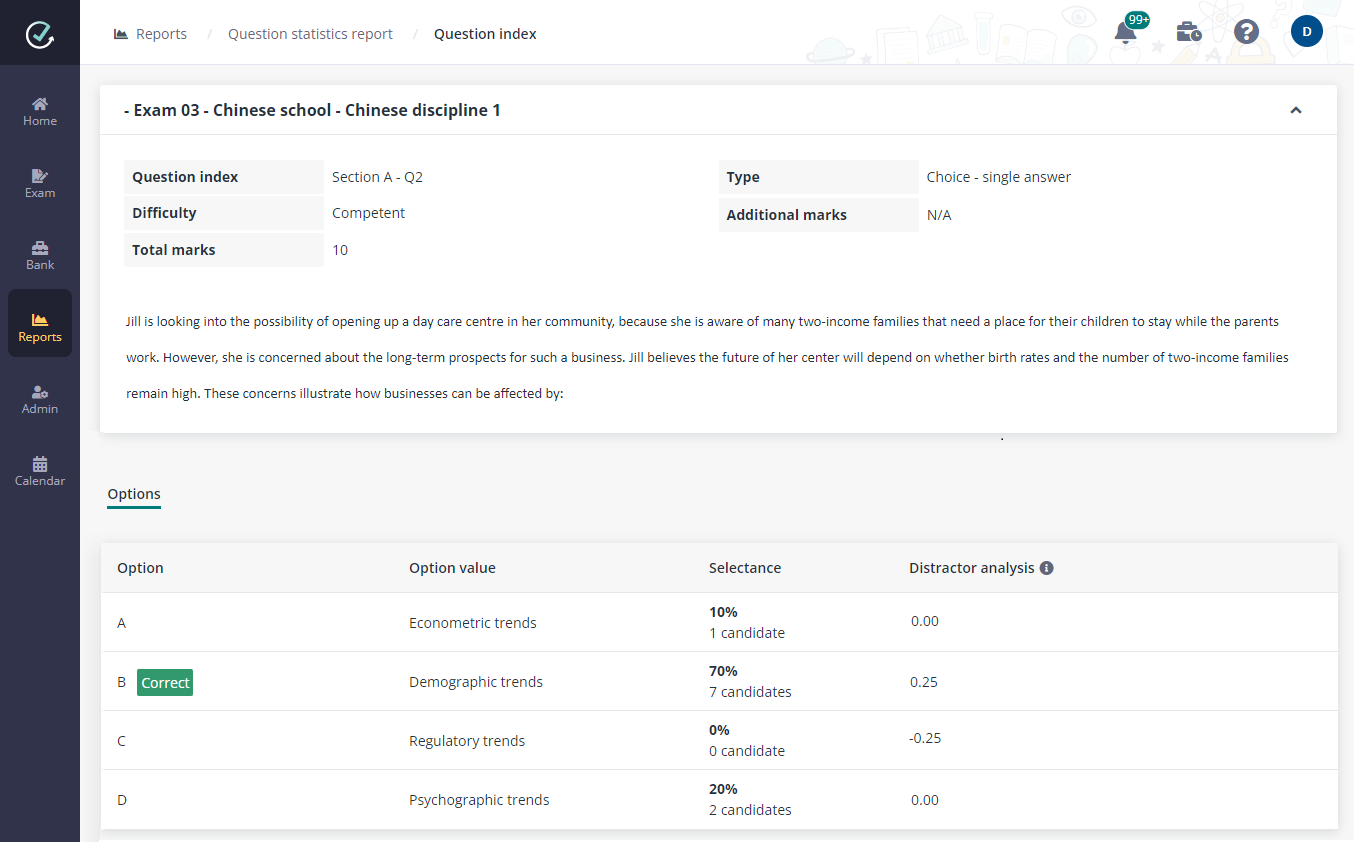
4. If exam candidates are assigned to teams, you can click the links in the Question index column to view the question statistics of each team under the Team view. If exam candidates come from different classes, you can view the question statistics of each class under the Class view.
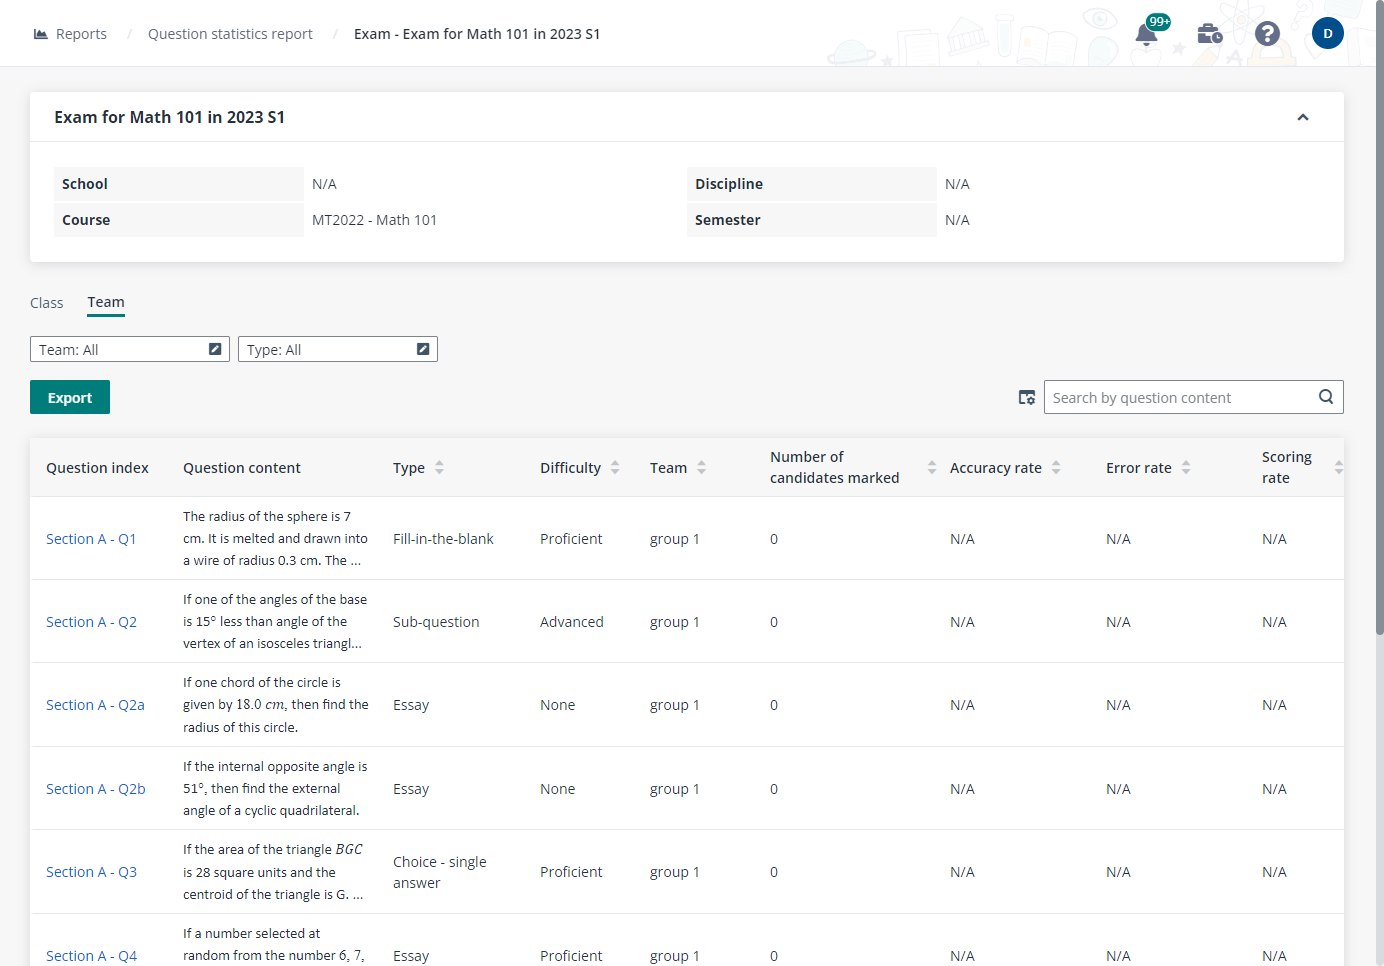
5. For each question statistic, both Discrimination index and Point biserial are calculated and displayed in the table.
•Discrimination index (DI) is displayed to provide a measure of how well a question discriminates between the top scorers and the bottom scorers on the question. DI values range from -1.0 to 1.0. The lowest recommended DI is 0.2. If there is a <20% difference between the candidates in the top-scoring and low-scoring groups responding to the question correctly, the question is not discriminating between the high and low scores as effectively.
•Point biserial is displayed to help staff know whether the question is doing a good job of discriminating the high-performing candidates from the low-performing candidates. The closer a question’s point biserial correlation is to 1.0 the more reliable the question is considered because the candidates who get the question correct also have a relatively high score on the overall exam.
6. You can also click Export to export the currently displayed question statistics report.
Derek wants to get an overview of the exam statistics for a specific candidate and export a report. He can follow the steps below:
1. On the Candidate statistics report page, use the Course and Class filters to show the candidates that match your filter conditions. If organisations and semesters are configured, the organisation and semester filters are also available.
You can also use the Search box in the upper-right corner to search for the candidate by the keyword in their Candidate name. The candidate matching your search will be displayed in the table.
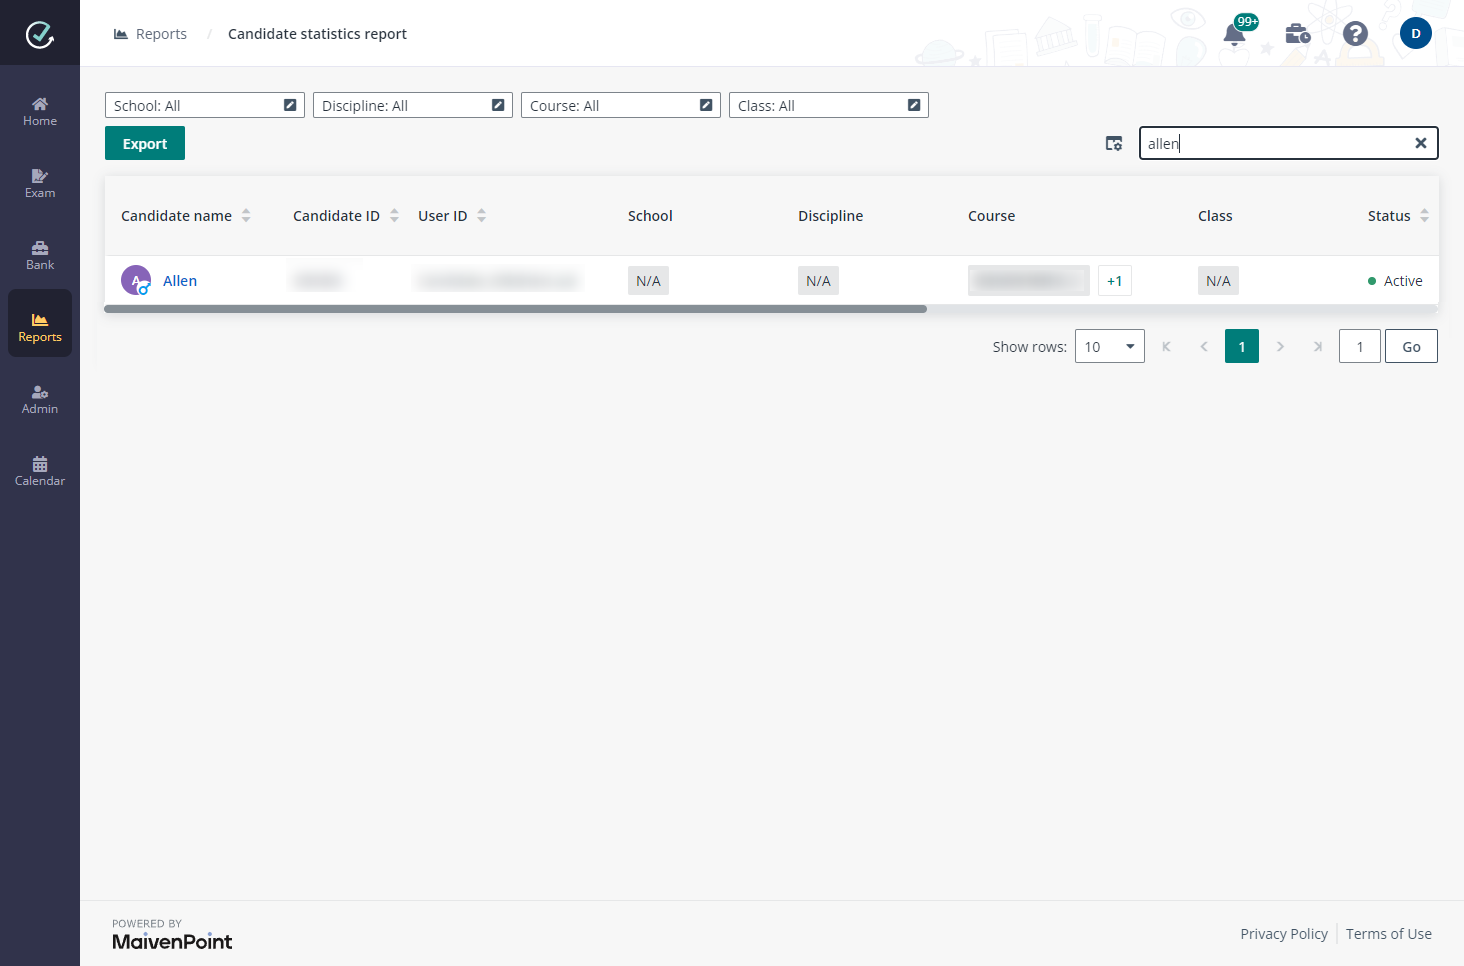
2. For a specific candidate, you can click the links in the Candidate name column to check the candidate exam score of each exam that has exam results published.
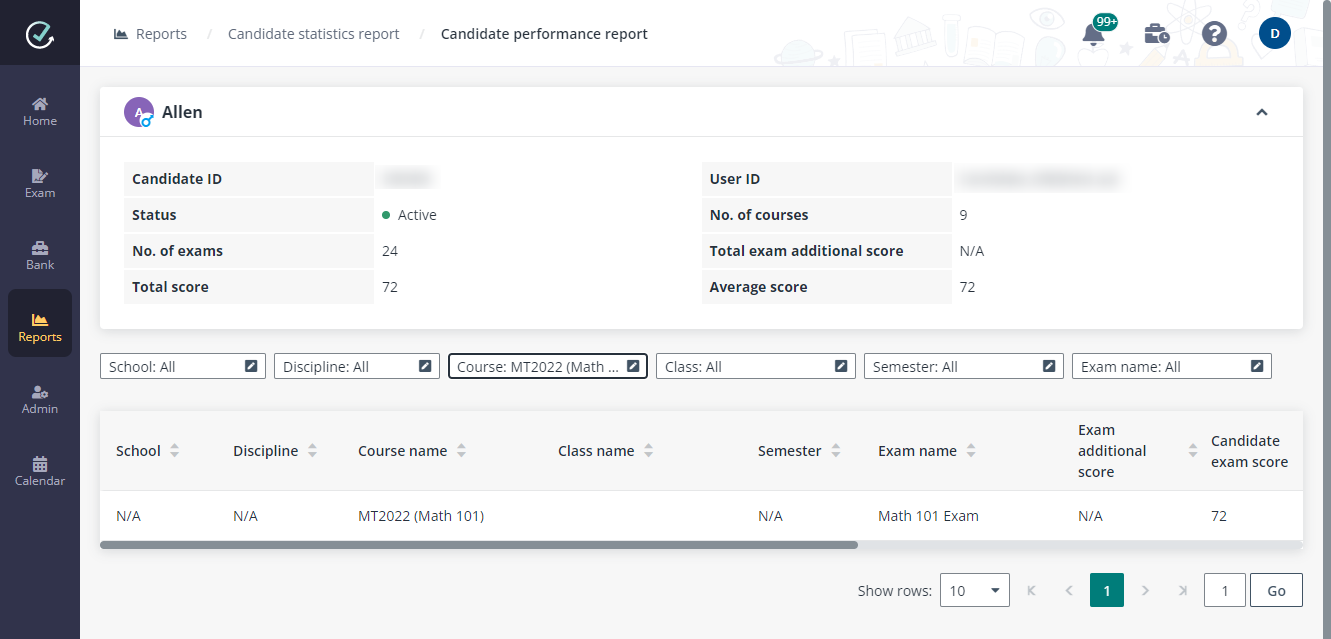
3. Use the Course, Class, or Exam name filter to show the exams that match your filter conditions. If organisations and semesters are configured, the organisation and semester filters are also available.
4. You can also click Export to export the currently displayed candidate statistics report.