Curricula provides a Power BI report template to help users
visualise data in Power BI desktop. To view Power BI reports, complete the
following configurations in order.
First, create a report database connection
1. In MaivenPoint
Online Services, click Settings on the left navigation pane, and then
click Report database.
*Note: The tenant owner or service admin of
MaivenPoint Online Services has the permission to create a database connection.
If the application admin has no permissions for this operation, contact the
tenant owner or service admin to perform it.
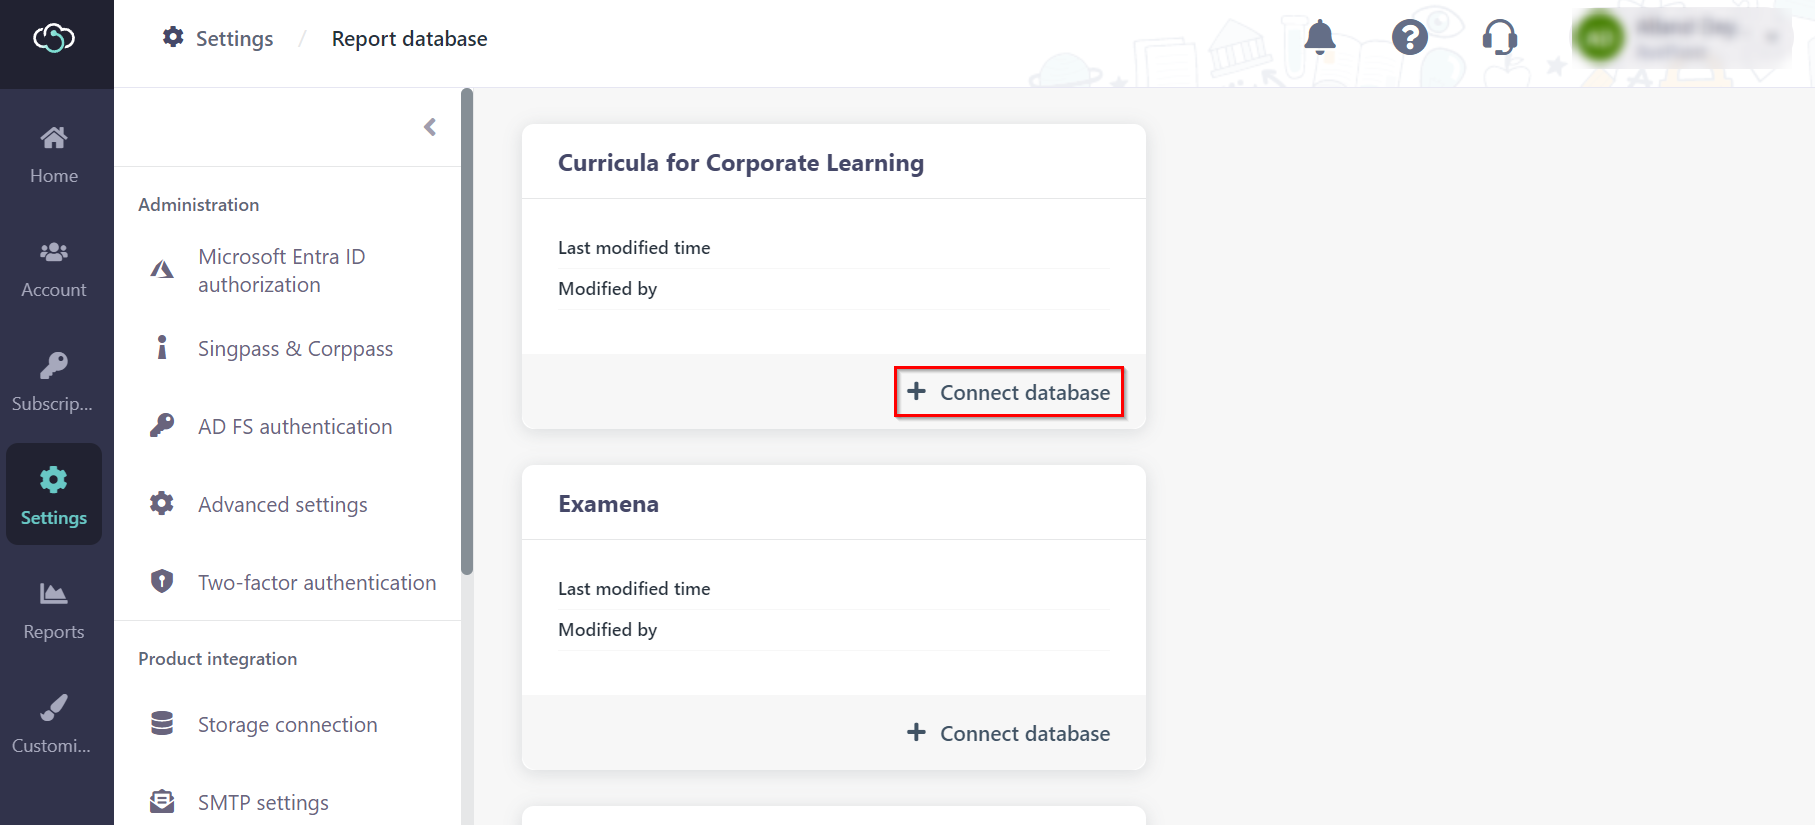
2. On the
Curricula for Corporate Learning card, click Connect database.
3. In
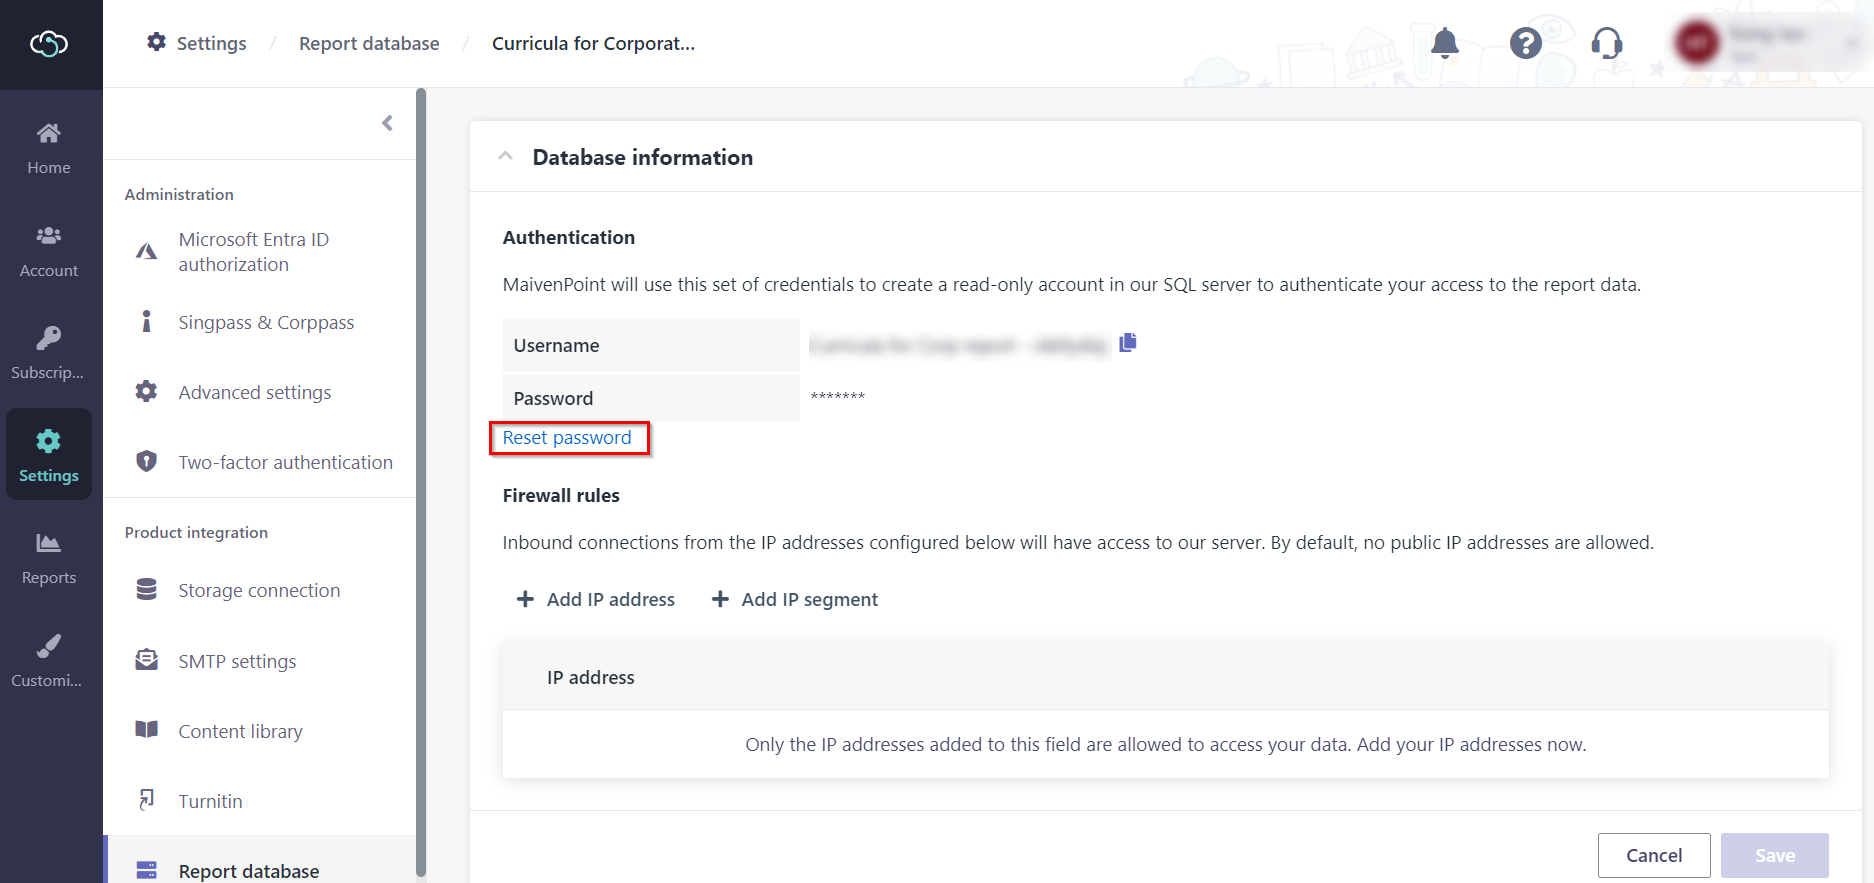
Authentication, there is a default username. Click Reset password
to set a password. This set of credentials is used to create a read-only account
in our SQL server to authenticate access to the report data.
4. In Firewall
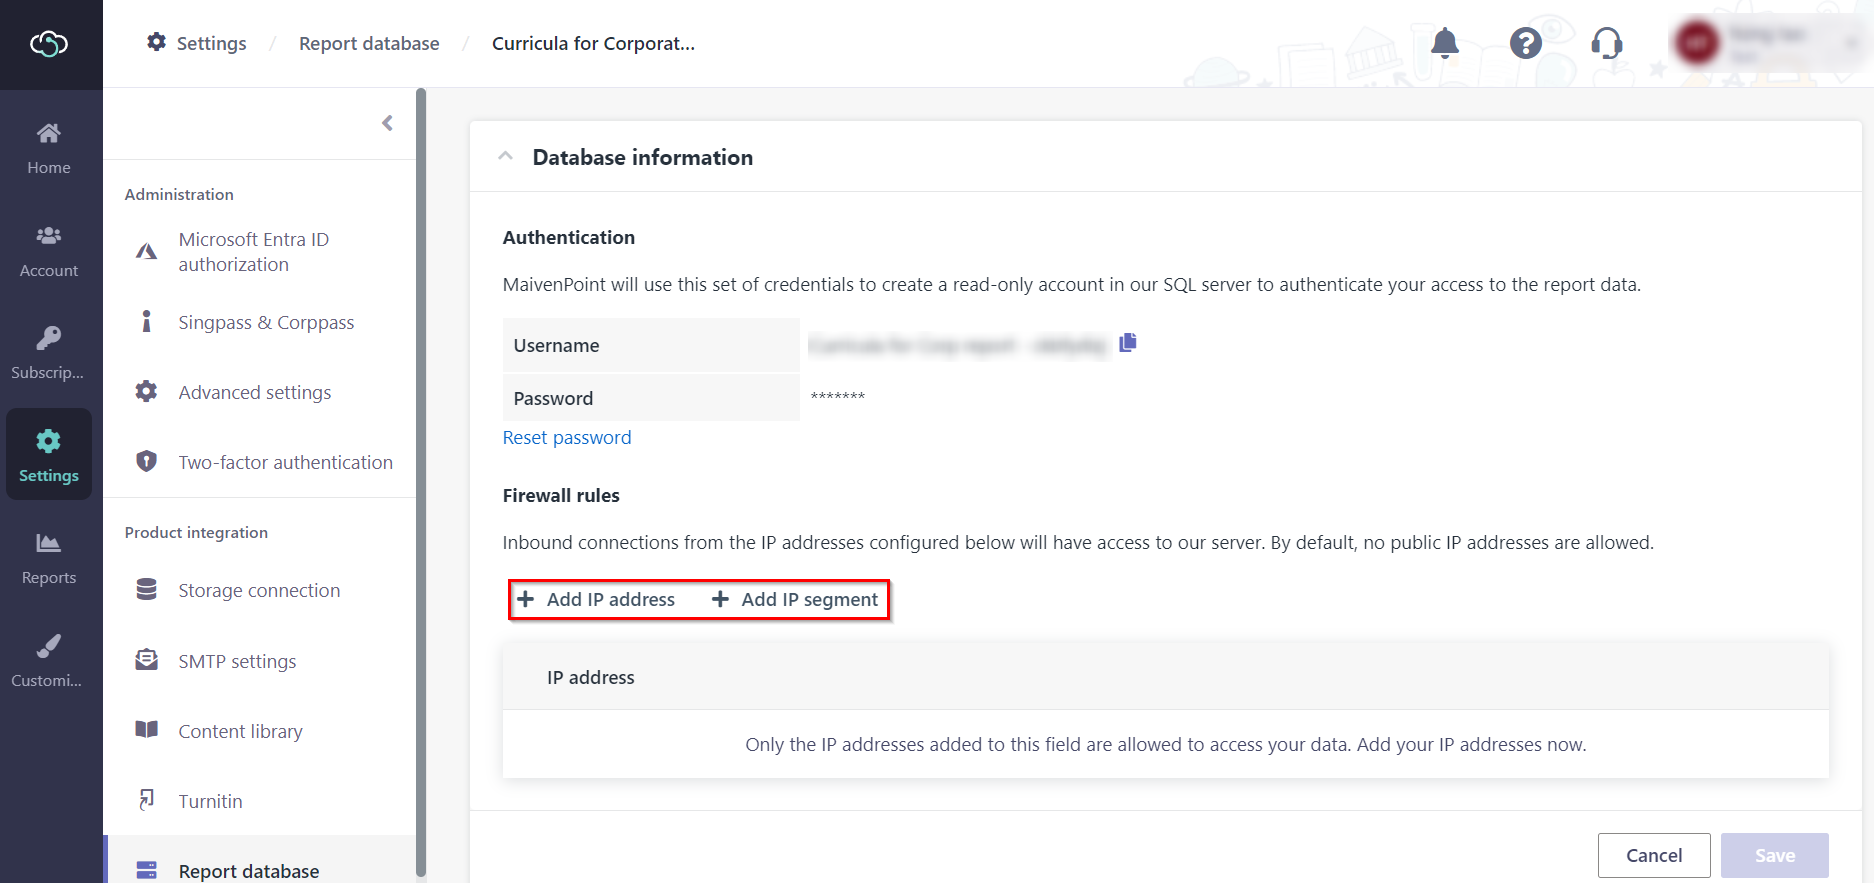
rules, you need to add an IP address or IP segment. Only the IP addresses
added to this field are allowed to access the report data.
5. Click
Save. The connection details are displayed below. You can use the
connection details when retrieving data from the report database later.
*Note: Data will not be synced from the system to
the report database immediately after you create the report database connection.
There is a data sync job to sync data to the report database, which occurs daily
on the hour. You need to wait for the next data sync job to complete before
connecting the Power BI template to the report database to generate the Power BI
report.
Second, download a Power BI template
In Curricula, click Report on the left navigation
pane, and then click Download Power BI report Template on the Power BI
report card. A power BI report template will be downloaded to the default
download location of the current browser.
Third, retrieve data from the report database
1. Find the
downloaded power BI report template and open it with Power BI Desktop.
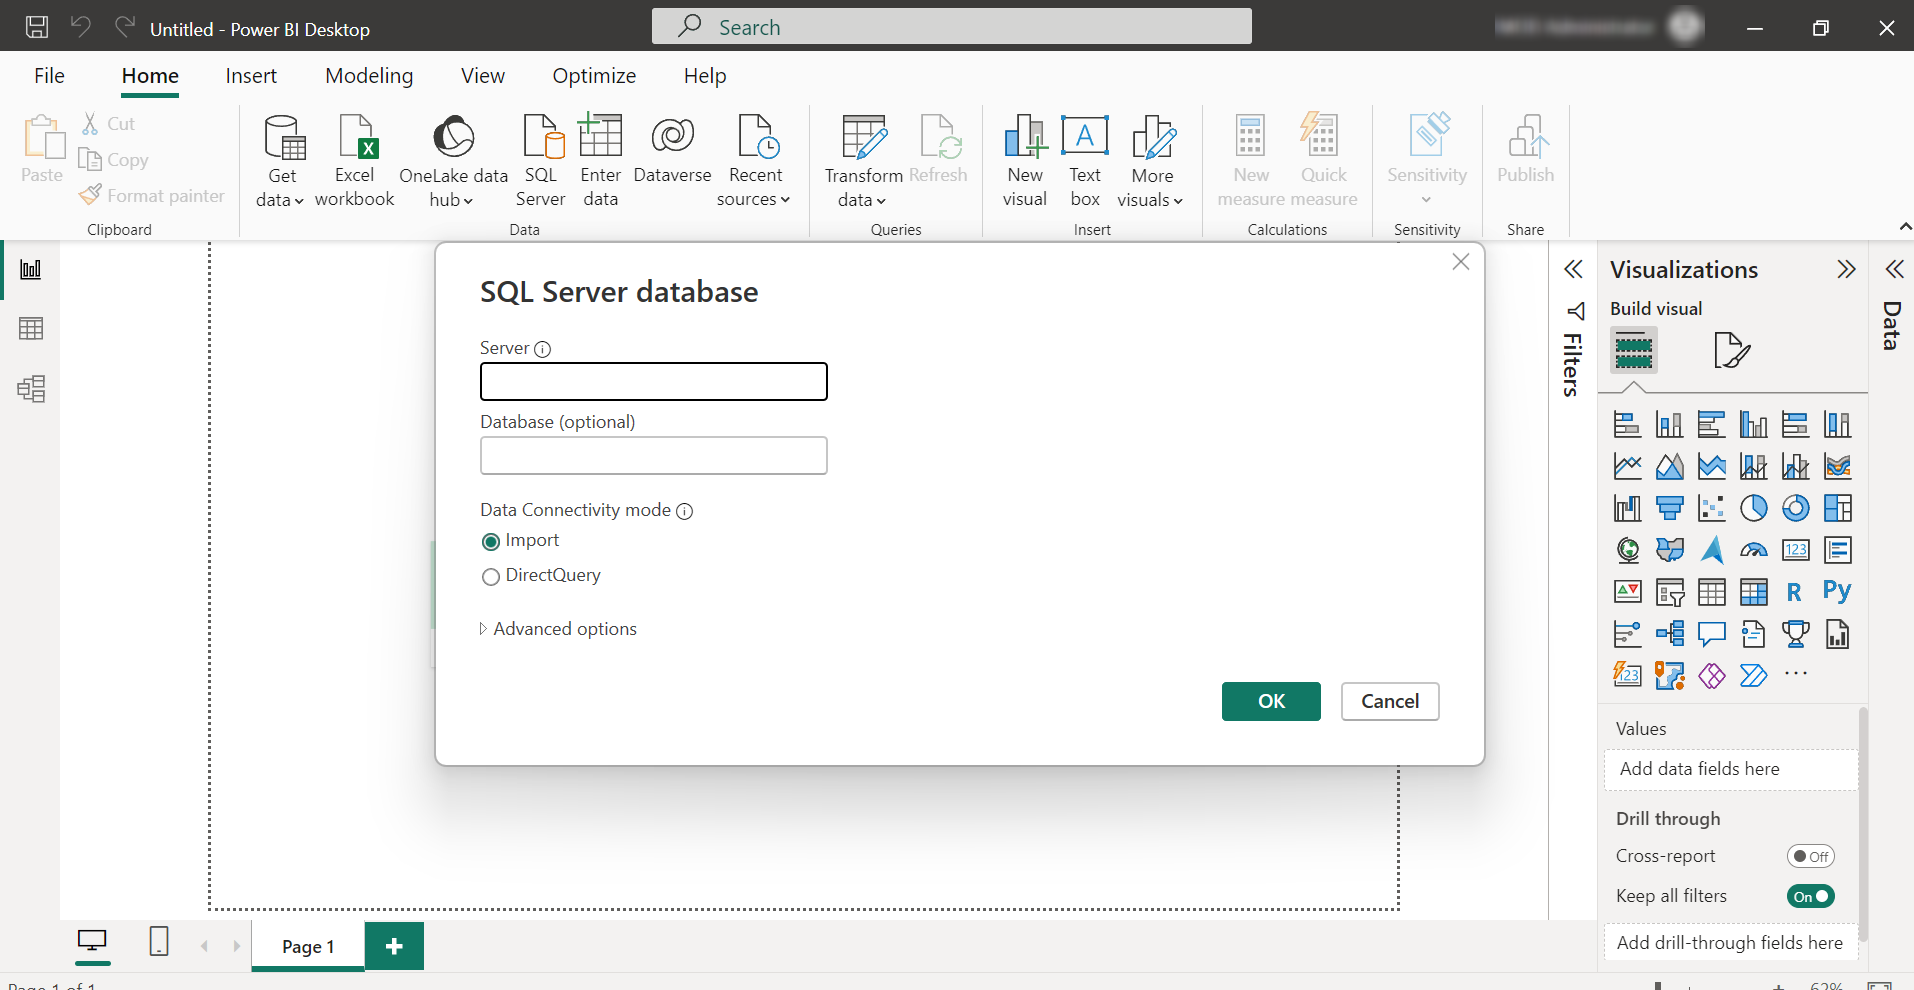
2. The SQL Server
database window automatically pops up.
Alternatively, click Get data > SQL Server
under the Data group to open the SQL Server database window.
3. Complete the SQL
server information and click OK.
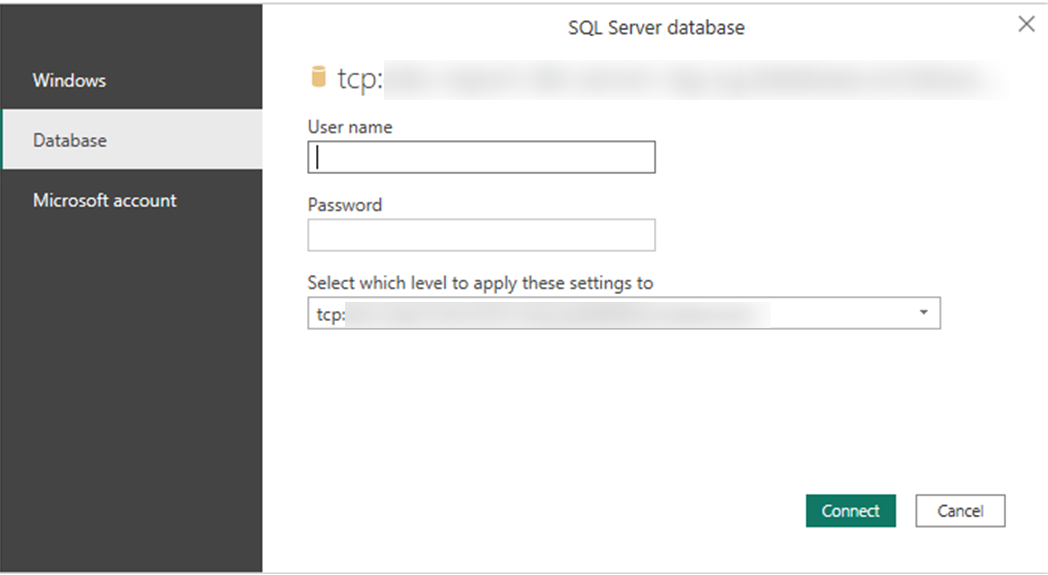
4. Switch to the
Database tab. Complete user credentials and click Connect to
connect to the report database.
5. Select all
database tables, and then click Load to load report data.
6. When the loading
completes, you can view the generated Power BI report. This might take a few
minutes based on the data size.
7. To refresh the
report data, click Refresh in the ribbon.
*Note: Data in the report database is not collected
in real time. There is a data sync job to sync data from the system to the
report database, which occurs daily on the hour. After you click Refresh,
the Power BI report will show the data collected by the last data sync
job.


